Who is the English golfer in 2025? Hint: he’s younger, she’s sharper, and they’re all carding more scores than a ticket inspector at St Andrews.
The English golfer has undergone a fast forward in evolution, and the latest 2024 numbers from England Golf prove it beyond the shadow of a clubhouse pint.
An English golfer today is more likely to tap a score into the World Handicap System™ app than to tap a playing partner’s shoulder for a gimme.
In fact, 10.2 million scores—yes, million—were submitted last year, a record that would make Old Tom Morris reach for his mashie.
A bumper crop of rounds
Competition rounds surged to 5.7 million, up from 5.4 million in 2023, while general‑play cards rocketed from 3.9 million to 4.4 million.
That’s more strokes than a politician’s ego, and it signals that golfers are no longer sandbagging in silence—they’re broadcasting every bladed wedge for the world to see.
Club loyalists vs. iGolfers: Same fairways, different paths
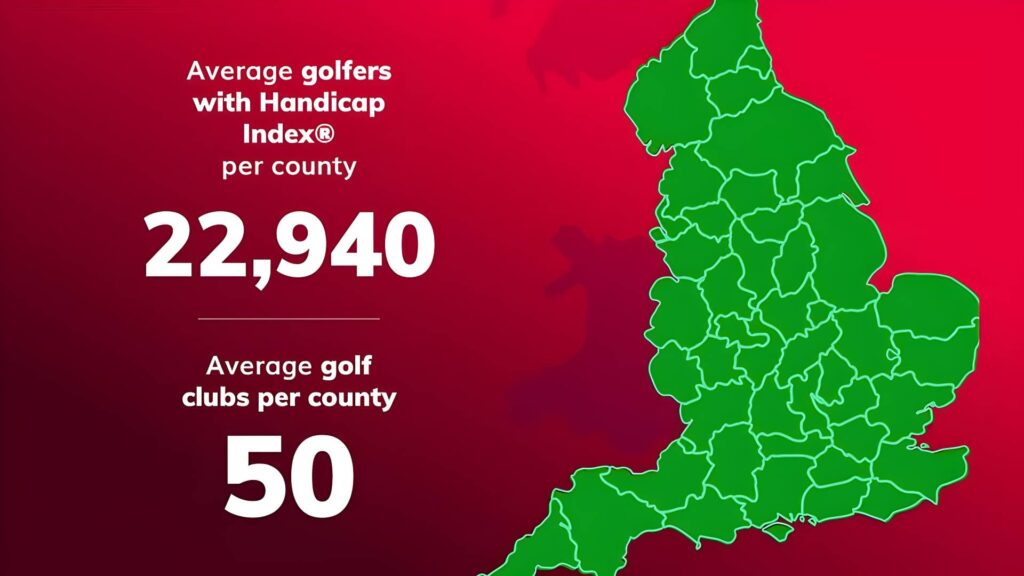
England still fields a mighty 1,735 affiliated clubs—roughly 50 per county—hosting over 730,000 card‑carrying members.
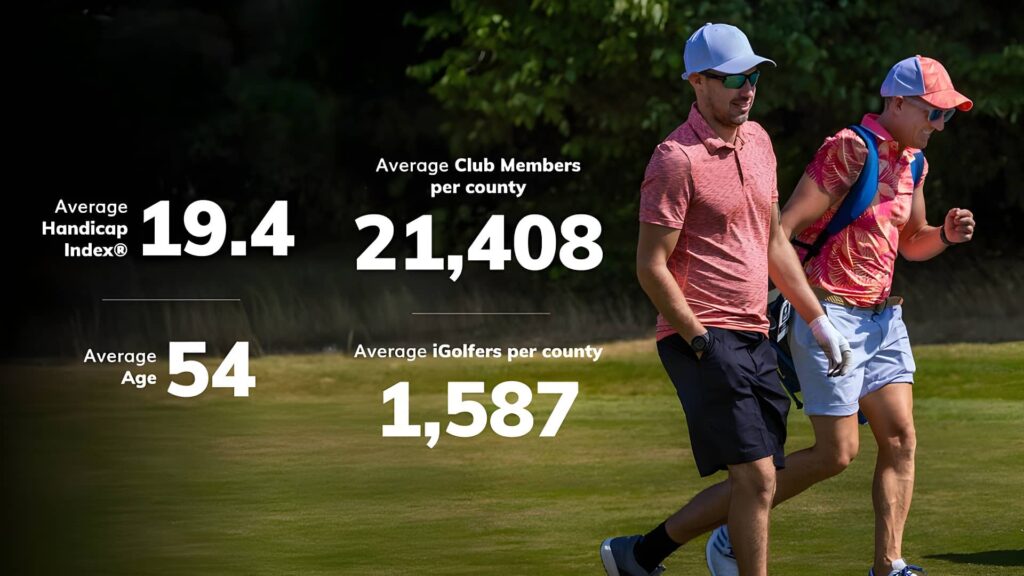
But iGolfers (pay-and-play subscribers to England Golf’s official handicap scheme) have muscled in with 55,000 strong and 494,000 scores of their own. Together, club members and iGolfers form a 785,000‑player army of officially handicapped sticks.
Handicaps: The level(er) playing field
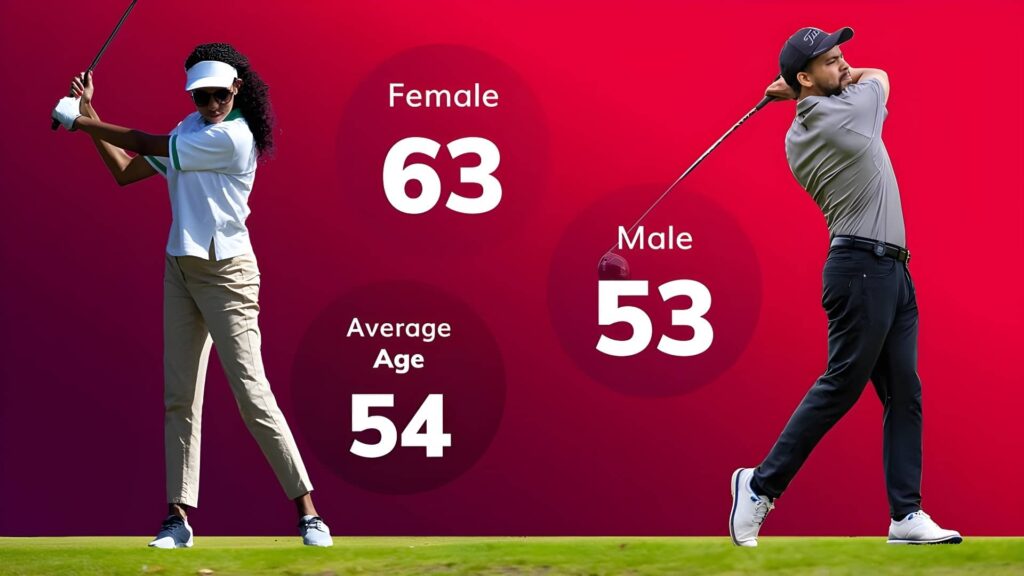
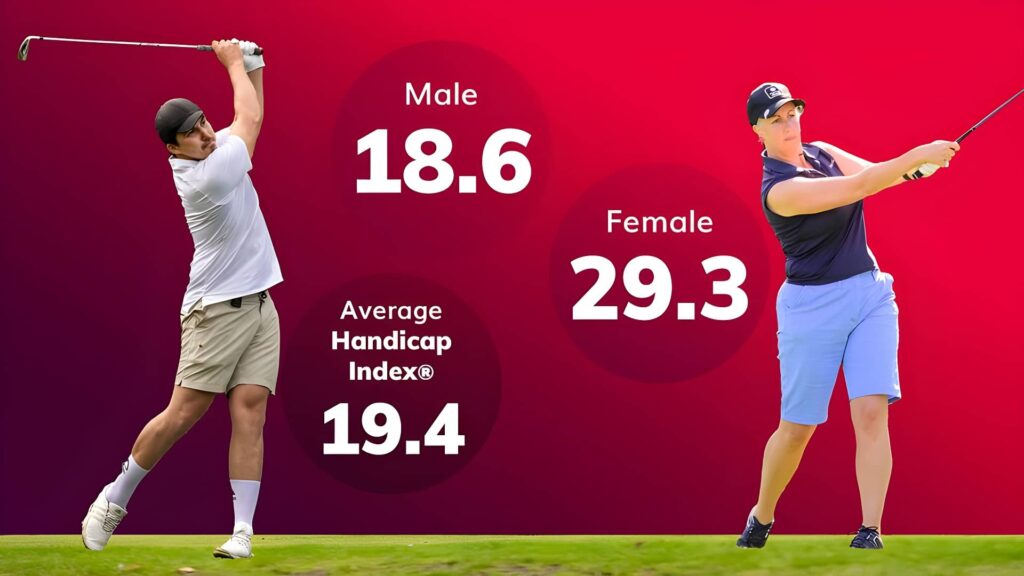
The nation’s combined average Handicap Index® now sits at 19.37 (men 18.60, women 29.33). Club members remain slightly sharper at 18.62, while iGolfers hover at 20.07. Still, that gap is narrower than a turned‑down four‑foot putt.
The age curve bends younger
You can thank modern drivers, YouTube tips, and perhaps a few Netflix docu‑dramas: the average English golfer is getting younger.
Club members’ average age dropped from 56.18 to 54.99, while iGolfers average only 43.
Middlesex & London leads the youth brigade at 47.75 years overall—impressive for a region where green fees can rival the rent.
Region‑by‑region bragging rights
- Most golfers overall: Yorkshire (74,927). Must be all that fresh Dales air.
- Lowest average handicap: Isle of Man (16.65). Fewer sheep, more fairways?
- Most iGolfers: Middlesex & London (7,596). Urban golf is alive and ringing tills.
- Youngest iGolfers: Cambridgeshire (42.19). Silicon Fen meets silicon face drivers.
- Most clubs in one county: Yorkshire again (181). No wonder they talk about “God’s own country.”
Why it matters
More scores mean better data, fairer handicaps, and full tee sheets that secure the future of clubs from Truro to Tyneside.
As the English golfer keeps trending younger and keener, expect pace‑of‑play apps, LED‑lit ranges and five‑hour Sunday rounds to become as common as a misplaced provisional.
So next time you queue on the first tee, glance around: the English golfer beside you is statistically more likely than ever to be mid‑50s instead of late‑50s, wielding a 19‑handicap instead of a 21—and, crucially, she might be live‑tracking every shot. Smile, swing, and hope you’re not featured on someone’s highlight reel.
iGolfers per County
| County | iGolfers |
|---|---|
| Middlesex & London | 7596 |
| Surrey | 4024 |
| Yorkshire | 4001 |
| Essex | 3576 |
| Berks, Bucks & Oxon | 3451 |
| Kent | 3313 |
| Hampshire, Isle of Wight & Channel Islands | 2682 |
| Lancashire | 2351 |
| Hertfordshire | 2011 |
| Cheshire | 1889 |
| Sussex | 1558 |
| Warwickshire | 1159 |
| Staffordshire | 1149 |
| Somerset | 970 |
| Nottinghamshire | 940 |
| Gloucestershire | 890 |
| Wiltshire | 856 |
| Lincolnshire | 842 |
| Northamptonshire | 821 |
| Derbyshire | 806 |
| Leicestershire & Rutland | 803 |
| Dorset | 767 |
| Cambridgeshire | 758 |
| Devon | 740 |
| Bedfordshire | 702 |
| Worcestershire | 674 |
| Durham | 606 |
| Suffolk | 479 |
| Northumberland | 465 |
| Norfolk | 450 |
| Shropshire & Herefordshire | 382 |
| Cornwall | 242 |
| Cumbria | 120 |
| Isle of Man | 25 |

Average iGolfer Age
| County | Average Age |
|---|---|
| Cambridgeshire | 42.19 |
| Shropshire & Herefordshire | 42.61 |
| Somerset | 42.69 |
| Bedfordshire | 42.74 |
| Yorkshire | 42.77 |
| Gloucestershire | 42.84 |
| Middlesex & London | 42.84 |
| Lincolnshire | 42.87 |
| Suffolk | 42.89 |
| Essex | 42.99 |
| Staffordshire | 43.05 |
| Northamptonshire | 43.12 |
| Norfolk | 43.16 |
| Devon | 43.20 |
| Berks, Bucks & Oxon | 43.21 |
| Lancashire | 43.24 |
| Hampshire, Isle of Wight & Channel Islands | 43.36 |
| Kent | 43.37 |
| Dorset | 43.51 |
| Nottinghamshire | 43.60 |
| Sussex | 43.70 |
| Derbyshire | 43.75 |
| Warwickshire | 43.83 |
| Worcestershire | 43.90 |
| Hertfordshire | 43.91 |
| Surrey | 43.93 |
| Northumberland | 43.97 |
| Durham | 44.05 |
| Cheshire | 44.17 |
| Cumbria | 44.24 |
| Leicestershire & Rutland | 44.25 |
| Cornwall | 44.55 |
| Wiltshire | 45.23 |
| Isle of Man | 47.67 |
Average iGolfer Handicap Index®
| County | Average Handicap |
|---|---|
| Isle of Man | 16.45 |
| Cumbria | 18.60 |
| Middlesex & London | 18.94 |
| Surrey | 18.95 |
| Kent | 18.98 |
| Cheshire | 19.18 |
| Essex | 19.36 |
| Bedfordshire | 19.48 |
| Warwickshire | 19.57 |
| Northumberland | 19.59 |
| Hertfordshire | 19.65 |
| Sussex | 19.74 |
| Nottinghamshire | 19.88 |
| Leicestershire & Rutland | 19.95 |
| Northamptonshire | 19.98 |
| Berks, Bucks & Oxon | 19.98 |
| Lancashire | 19.99 |
| Derbyshire | 20.03 |
| Durham | 20.10 |
| Dorset | 20.15 |
| Gloucestershire | 20.49 |
| Yorkshire | 20.52 |
| Shropshire & Herefordshire | 20.56 |
| Wiltshire | 20.58 |
| Somerset | 20.68 |
| Norfolk | 20.68 |
| Devon | 20.83 |
| Staffordshire | 20.89 |
| Hampshire, Isle of Wight & Channel Islands | 21.20 |
| Worcestershire | 21.29 |
| Lincolnshire | 21.44 |
| Suffolk | 21.50 |
| Cornwall | 21.74 |
| Cambridgeshire | 22.35 |
Golf Club Members
| County | Golf Club Members |
|---|---|
| Yorkshire | 70926 |
| Lancashire | 49990 |
| Surrey | 47779 |
| Berks, Bucks & Oxon | 38998 |
| Cheshire | 38933 |
| Kent | 33477 |
| Hampshire, Isle of Wight & Channel Islands | 32998 |
| Essex | 29311 |
| Sussex | 27345 |
| Hertfordshire | 26819 |
| Gloucestershire | 20441 |
| Durham | 20181 |
| Staffordshire | 19684 |
| Lincolnshire | 18973 |
| Warwickshire | 18887 |
| Devon | 17958 |
| Northumberland | 15881 |
| Suffolk | 15593 |
| Dorset | 14896 |
| Nottinghamshire | 14103 |
| Somerset | 14085 |
| Worcestershire | 14052 |
| Norfolk | 13548 |
| Leicestershire & Rutland | 13057 |
| Cornwall | 12489 |
| Wiltshire | 12338 |
| Middlesex | 12147 |
| Derbyshire | 10535 |
| Shropshire & Herefordshire | 10283 |
| Bedfordshire | 10265 |
| Cumbria | 9741 |
| Northamptonshire | 9702 |
| Cambridgeshire | 9617 |
| Isle of Man | 2825 |
Golf Club Members Average Age
| County | Average Age |
|---|---|
| Isle of Man | 51.37 |
| Middlesex | 52.66 |
| Cornwall | 53.31 |
| Durham | 53.45 |
| Surrey | 53.53 |
| Essex | 53.86 |
| Gloucestershire | 54.12 |
| Hertfordshire | 54.39 |
| Kent | 54.49 |
| Cumbria | 54.57 |
| Northamptonshire | 54.59 |
| Yorkshire | 54.61 |
| Leicestershire & Rutland | 54.62 |
| Cheshire | 54.67 |
| Lancashire | 54.68 |
| Wiltshire | 54.89 |
| Staffordshire | 55.05 |
| Suffolk | 55.10 |
| Northumberland | 55.23 |
| Derbyshire | 55.23 |
| Cambridgeshire | 55.48 |
| Berks, Bucks & Oxon | 55.51 |
| Somerset | 55.56 |
| Shropshire & Herefordshire | 55.56 |
| Bedfordshire | 55.64 |
| Norfolk | 55.82 |
| Lincolnshire | 55.95 |
| Warwickshire | 55.97 |
| Nottinghamshire | 56.00 |
| Sussex | 56.10 |
| Hampshire, Isle of Wight & Channel Islands | 56.14 |
| Worcestershire | 56.21 |
| Devon | 56.76 |
| Dorset | 56.93 |
Golf Club Members Average Handicap Index®
| County | Average Handicap |
|---|---|
| Isle of Man | 16.84 |
| Nottinghamshire | 17.46 |
| Durham | 17.47 |
| Surrey | 17.54 |
| Kent | 17.83 |
| Leicestershire & Rutland | 17.93 |
| Hertfordshire | 17.94 |
| Northumberland | 18.05 |
| Essex | 18.24 |
| Gloucestershire | 18.28 |
| Wiltshire | 18.51 |
| Warwickshire | 18.54 |
| Northamptonshire | 18.60 |
| Berks, Bucks & Oxon | 18.60 |
| Yorkshire | 18.66 |
| Cumbria | 18.67 |
| Lancashire | 18.69 |
| Cheshire | 18.89 |
| Lincolnshire | 19.01 |
| Derbyshire | 19.04 |
| Shropshire & Herefordshire | 19.05 |
| Bedfordshire | 19.08 |
| Middlesex | 19.09 |
| Cornwall | 19.37 |
| Staffordshire | 19.38 |
| Hampshire, Isle of Wight & Channel Islands | 19.42 |
| Cambridgeshire | 19.50 |
| Sussex | 19.51 |
| Somerset | 19.67 |
| Dorset | 19.69 |
| Worcestershire | 19.74 |
| Suffolk | 19.82 |
| Norfolk | 19.92 |
| Devon | 20.16 |
Total golfers with a Handicap Index®
| County | Total Golfers |
|---|---|
| Yorkshire | 74927 |
| Lancashire | 52341 |
| Surrey | 51803 |
| Berks, Bucks & Oxon | 42449 |
| Cheshire | 40822 |
| Kent | 36790 |
| Hampshire, Isle of Wight & Channel Islands | 35680 |
| Essex | 32887 |
| Sussex | 28903 |
| Hertfordshire | 28830 |
| Gloucestershire | 21331 |
| Staffordshire | 20833 |
| Durham | 20787 |
| Warwickshire | 20046 |
| Lincolnshire | 19815 |
| Middlesex & London | 19743 |
| Devon | 18698 |
| Northumberland | 16346 |
| Suffolk | 16072 |
| Dorset | 15663 |
| Somerset | 15055 |
| Nottinghamshire | 15043 |
| Worcestershire | 14726 |
| Norfolk | 13998 |
| Leicestershire & Rutland | 13860 |
| Wiltshire | 13194 |
| Cornwall | 12731 |
| Derbyshire | 11341 |
| Bedfordshire | 10967 |
| Shropshire & Herefordshire | 10665 |
| Northamptonshire | 10523 |
| Cambridgeshire | 10375 |
| Cumbria | 9861 |
| Isle of Man | 2850 |
Average Age
| County | Average Age |
|---|---|
| Middlesex & London | 47.75 |
| Essex | 48.43 |
| Gloucestershire | 48.48 |
| Yorkshire | 48.69 |
| Surrey | 48.73 |
| Durham | 48.75 |
| Cambridgeshire | 48.84 |
| Northamptonshire | 48.86 |
| Kent | 48.93 |
| Cornwall | 48.93 |
| Lancashire | 48.96 |
| Suffolk | 49.00 |
| Staffordshire | 49.05 |
| Shropshire & Herefordshire | 49.09 |
| Somerset | 49.13 |
| Hertfordshire | 49.15 |
| Bedfordshire | 49.19 |
| Berks, Bucks & Oxon | 49.36 |
| Cumbria | 49.41 |
| Lincolnshire | 49.41 |
| Cheshire | 49.42 |
| Leicestershire & Rutland | 49.44 |
| Derbyshire | 49.49 |
| Norfolk | 49.49 |
| Isle of Man | 49.52 |
| Northumberland | 49.60 |
| Hampshire, Isle of Wight & Channel Islands | 49.75 |
| Nottinghamshire | 49.80 |
| Warwickshire | 49.90 |
| Sussex | 49.90 |
| Devon | 49.98 |
| Worcestershire | 50.06 |
| Wiltshire | 50.06 |
| Dorset | 50.22 |
Golf Clubs per County
| County | Golf Clubs |
|---|---|
| Yorkshire | 181 |
| Lancashire | 141 |
| Berks, Bucks & Oxon | 103 |
| Surrey | 102 |
| Cheshire | 97 |
| Kent | 82 |
| Hampshire & Channel Islands | 76 |
| Essex | 72 |
| Hertfordshire | 60 |
| Sussex | 59 |
| Staffordshire | 47 |
| Lincolnshire | 45 |
| Warwickshire | 44 |
| Durham | 43 |
| Devon | 42 |
| Northumberland | 39 |
| Gloucestershire | 38 |
| Dorset | 34 |
| Nottinghamshire | 33 |
| Worcestershire | 33 |
| Middlesex | 32 |
| Norfolk | 31 |
| Cornwall | 30 |
| Cumbria | 29 |
| Derbyshire | 29 |
| Somerset | 29 |
| Suffolk | 29 |
| Shropshire & Herefordshire | 28 |
| Leicestershire & Rutland | 26 |
| Wiltshire | 24 |
| Northamptonshire | 23 |
| Bedfordshire | 22 |
| Cambridgeshire | 19 |
| Isle of Man | 8 |